

By TAMAKI STILES, Financial Analysis and Data Management Advisor, Leaders in Energy
One of the challenges for Japanese electric power companies is their heavy reliance on fossil fuels to generate electricity. The market for electricity generation in Japan is the sixth largest in the world and the third largest in Asia, behind China and India.[1] Japan is also the world’s third largest importer of oil and coal and the largest importer of liquefied natural gas (LNG).[2]
Electric power companies use natural gas to generate electricity because it has higher fuel efficiency, shorter construction lead times, and lower emissions.[3] Natural gas can be compressed into a liquefied form and can be stored, so that when demand for electricity spikes, the utility can meet peak demand. Also, natural gas in the LNG form can be transported without using a pipeline.
The U.S. is the largest natural gas producer in the world. Increased shale gas production in the U.S. has promoted discussions on natural gas exports, particularly LNG. As an energy producer, the U.S. can supply the market for LNG, which is largest in Asia, including Japan, South Korea, and China. Several natural gas liquefaction plants are being built or are in the permitting process in the U.S. to begin exporting supplies overseas, some of which is targeted for Japan.[4]
Trends in the LNG market in Japan therefore have a significant impact on global energy markets, with implications for the global economy and security. This article examines the outlook based on the Annual Report on Energy published by the Agency for Natural Resources and Energy in Japan as well as other sources to shed some insight on the trends in this market. The data from these references are plotted in the charts below.
Energy Mix before and after Fukushima
Before the Fukushima nuclear disaster in 2011, dependence on fossil fuels in Japan was at about 60%. Back then, about 30% of electricity generated was from nuclear power. After Fukushima, the proportion of nuclear power in the energy mix dropped precipitously, and Japan turned to fossil fuels, including LNG, coal, and oil. As a result, in fiscal year (FY) 2015, 85% of electricity generated in Japan was from fossil fuels (Figure 1); with natural gas contributing 44%. In comparison, in the U.S. 67% of electricity was generated from fossil fuels in 2015 (EIA); with natural gas contributing 33%.
Figure 1: Energy mix for electricity generated in Japan
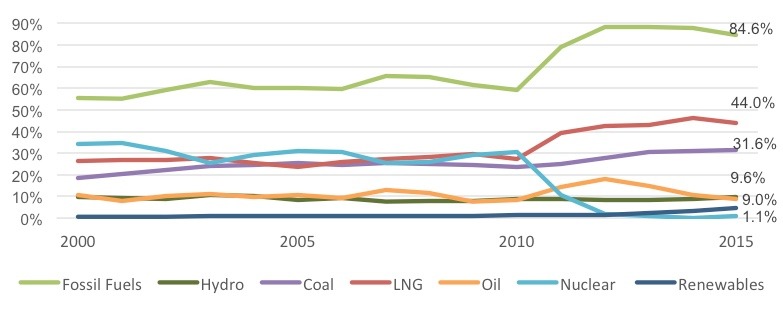
Source: Agency for Natural Resources and Energy, Annual Report on Energy, 2015.
It was LNG that offset the loss of nuclear power after Fukushima. According to EIA, “environmental concerns have led the [Japanese] government to encourage natural gas consumption, making LNG a fuel of choice for power generation.”[5] In fact, LNG imports increased by 25% from 2010 to 2014 despite a 50% increase in price (Figure 2).[6]
Figure 2: Fossil fuel imports in Japan
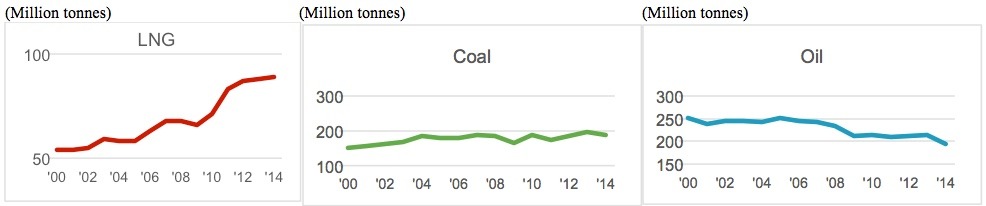
Source: Agency for Natural Resources and Energy, Annual Report on Energy, 2015; Trade statistics of Japan.
Although LNG imports declined to 85 million tonnes in 2015 from a record 88.5 million tonnes a year earlier, Japan is still the largest LNG importer in the world (Figure 3).[7] Japan accounts for about one third of global LNG imports (34%). It is more than double that of South Korea (13%) and more than four times as that of China (8%).
Figure 3: LNG imports by country
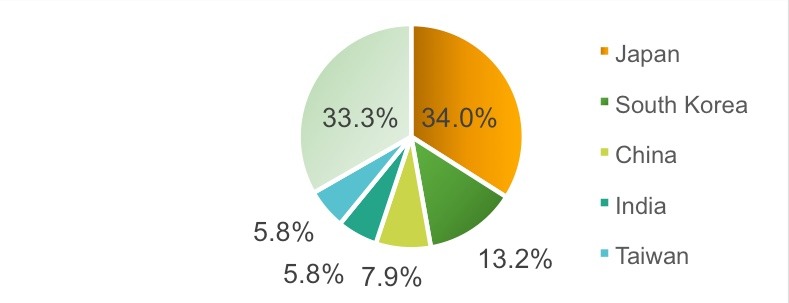
Source: International Gas Union, IGU World Gas LNG Report, 2016.
In 2014 Australia was the largest seller of LNG for Japan, followed by Qatar and Malaysia. Interestingly, Australia and Malaysia account for only 1.9% of the total gas production in the world and 5.1% for Qatar.[8] In contrast, the U.S. accounts for 22% of the world gas production.
On the demand side, with global oversupply and decreased LNG prices, the LNG market favors buyers. In fact, Japan has been seeking to shift away the traditional long-term, oil-indexed LNG contracts with fixed destination.
On the supply side, surplus gas surges into the LNG markets. It increases liquidity and the influence of spot hubs such as U.S. Henry Hub price signals.[9] U.S. gas prices are based on Henry Hub pricing, which offers lower gas prices than other regional gas prices.[10] It means that U.S. LNG contracts may have a price advantage, coupled with less price volatility. Also, if long-term contracts allow LNG buyers to renegotiate the resale restrictions, it would favor new suppliers in the U.S.
What does it mean for Japan?
While the increase in fossil fuel imports in Japan may be a good business opportunity for sellers, it severely affected the bottom line of Japanese electric power companies.
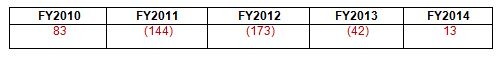
In order to make up for the amount of electricity that nuclear power plants used to generate annually before the earthquake, electric power companies had to rely heavily on fossil fuels to run thermal power plants. Since prices of oil and gas were rising between 2011 and June 2014, an increase in fossil fuel imports resulted in huge incremental costs in Japan. In fact, fuel costs swelled by $28 billion to $37 billion a year between FY2011 and FY2014. Since FY2013, LNG has showed the largest incremental costs among the fossil fuels (Table 1).
Table 1: Incremental fuel costs in Japan after nuclear power plants were shut down
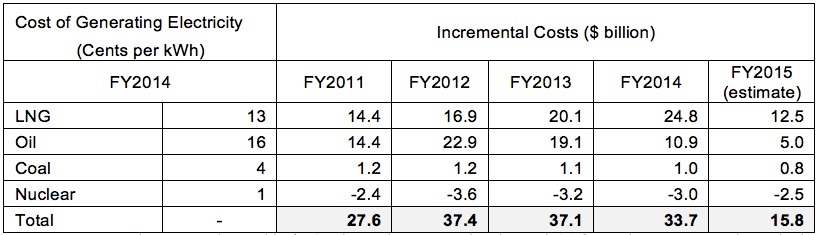
Source: Agency for Natural Resources and Energy, Annual Report on Energy, 2015; Electricity Supply-Demand Verification Subcommittee Report, April 2016.Note: Incremental costs are denoted in $US. The exchange rate dated March 31 for each year was used to calculate the costs.
To combat this sharp increase in fuel costs after the earthquake, Japanese electric power companies raised electric power rate. However, the fuel costs were too big to tackle, and they ended up with massive deficits between FY2011 and FY2013 (Table 2). The deficits not only affected Tokyo Electric, which owns Fukushima-Daiichi reactors, but also many other electric power companies in Japan because the Fukushima accident caused a gradual shutdown of their plants “because of scheduled maintenance and the lack of government approvals to return to operations”.[11] Considering these facts, we can say that the deficits are mostly because of the Fukushima response.
Table 2: Ordinary profit of 10 Japanese electric power companies (combined profit)
($ Billion)
Note: The profit is in $US. The exchange rate dated March 31 for each year was used to calculate the costs. Source: Agency for Natural Resources and Energy, Annual Report on Energy, 2015.
In FY2014, most electric power companies returned to positive earnings, after oil and LNG prices plunged after July 2014. Interestingly, those whose performance improved were the companies who switched to LNG-fired plants that are energy efficient, as well as coal-fired plants that are low cost.[12]
In contrast, Kansai Electric and Kyushu Electric were the only two electric power companies whose performance continued operating in the red in FY2014 because they still heavily relied on oil-fired plants.[13] For example, at Hokuriku Electric, only 8% of electricity generated was from oil in FY2014. In contrast, 17% of electricity generated for Kansai and 15% for Kyushu was from oil during the same period (based on data provided on their websites). This means that their business models involved more risks because running oil-fired plants is more costly than using other fossil fuels.
Consumption and Outlook for LNG
Now let’s look at the historical consumption trends for LNG in Japan. As you can see in Figure 4, the consumption of natural gas has been steadily growing for about 40 years.
Figure 4: Consumption of LNG in Japan (million tonnes)
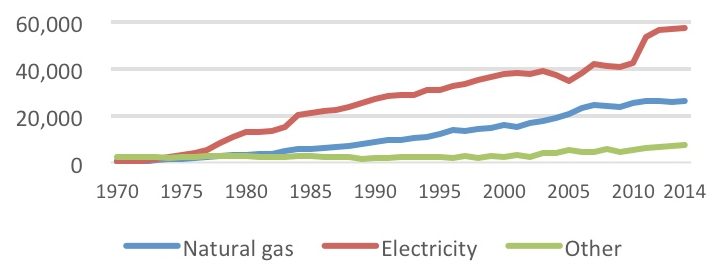
Source: Agency for Natural Resources and Energy, Annual Report on Energy, 2015.
In addition to electricity generation, the consumption of natural gas has been on an upward trend since 1980. Natural gas is used for cogeneration, also known as Combined Heat & Power (CHP). It is to capture the waste heat in electricity generation and send it as hot water, heating, and steam to local buildings. By using heat and electricity effectively, it is estimated that energy efficiency can be about 75-80%.[14]
Based on data from Advanced Cogeneration and Energy Utilization Center Japan, demand for cogeneration was steadily increasing up to 2006, and then recovered after the earthquake. The Ministry of Economy, Trade and Industry estimates that cogeneration could add almost 7 GW of electricity by 2030.[15] In addition, cogeneration provides back-up power supplies for data centers, offices, and hospitals. In fact, the government aims to increase the share of cogeneration out of the total electricity generated from 3% (2013) to 15% by 2030.[16] Natural gas has 44% less CO2 emissions than coal and over 20% less than oil when combusted.[17] As cogeneration spreads, it will contribute to decreasing fossil fuel consumption and CO2 emissions.
It is possible that Japan’s LNG demand may decline in the long run due to a declining population, slower economic growth, nuclear power plants restarting, and solar capacity increasing, as we see in the government forecasts in the next section.
EIA forecasts that Japan’s natural gas consumption is going to increase by an average of 0.9% .[18] They estimate that Japan’s natural gas share of total energy consumption is going to increase from 25% in 2020 to 30% in 2040, while it estimates that its oil and coal consumption is going to decline. It appears that environmental concerns favoring natural gas consumption after Fukushima and expansion of LNG terminals have influenced this forecast.
Another factor that may influence the consumption of natural gas is fuel cells. Fuel cells use hydrogen and oxygen to produce electric power. Currently, hydrogen comes mostly from natural gas. Considering that Japan plans to expand the use of fuel cells ahead of the Tokyo Olympics and Paralympics in 2020, demand for LNG is likely to grow. They want to use fuel cells widely for public transportation and electric supply for athletic facilities, so that it can sell its technology to the world and achieve sustainable development.[19] Also, by 2025 the government intends to improve energy efficiency by 55% by combining fuel cells with coal and LNG at power plants.[20]
Furthermore, Bloomberg projects that LNG-fired plants are going to play a bigger role, “based on utilities’ existing assets and project pipeline”.[21] It also estimates that as renewables such as solar power increase, their intermittent nature will require plants that run when there is peak demand for electricity. For example, the Martin Next Generation Solar Energy Center in Florida has such a structure that uses natural gas and solar power.
Policy intentions vs. market outlook
Now, what does the Japanese government think about its energy outlook? According to the long-term supply and demand outlook (bill) published in June 2015, the government projects that the share of LNG in energy generation is going to decrease from 43% (FY2013) to 27% (FY2030). On the other hand, it estimates that nuclear energy is going to increase from 1% (FY2013) to 20-22% (FY2030) and renewable energy will increase from 2.2% (FY2013) to 22-24% (FY2030).
Some experts argue that this outlook will be hard to achieve. One of the main reasons is the lack of nuclear power plants that can operate at a new standard. For example, before the earthquake, there were 54 nuclear power plants in Japan. After the earthquake, 11 plants are set to be discontinued. An additional 10 plants are at high risk because there are active faults in the area, or they are not up to the latest standard.[22] Moreover, the nuclear lifecycle is limited to 40 years based on the Nuclear Reactor Regulation Law, which was amended after the Fukushima nuclear accident.
With adjustments to the outlook based on this regulation, 14% of energy generated will be from nuclear power in FY2030. In order to increase the share of nuclear over the government forecast of 20%, they need to operate more nuclear plants exceeding the limit of 40-year lifecycle.
However, the new regulation explicitly states, “it is possible to extend the operation of nuclear power plants to 20 more years, only once”. Many experts argue that anti-nuclear protests in Japan may make it difficult to extend the operation of the nuclear power plants. In addition, doing so would require enormous additional costs in order for old plants to pass all the safety requirements for extension.[23] At this point, the government has announced no official plan for developing new nuclear power plants.
Some argue that this 2030 outlook reflects political goals, not necessarily based on pure market outlook.[24] The outlook was prepared by a committee under the Agency for Natural Resources and Energy, which is easily influenced by the political interests of protecting nuclear power plants.
Conclusion
Contrary to the government’s energy supply and demand outlook as well as current trends, LNG may continue to play a bigger role in electricity generation in Japan, as demand for fuel cells and natural gas continues to increase in the 2020s.
From a microeconomic point of view, LNG may be a way to contribute to the profitability of electric power companies as well. LNG has higher energy efficiency than other fossil fuels. It may also serve as a bridge to a transition to a cleaner economy, as natural gas would help reduce the consumption of other fossil fuels, which would lead to lowering CO2 emissions.
Tamaki Stiles is the Financial Analysis and Data Management Adviser for Leaders in Energy. Her experience includes financial models, budgets, economic analysis, and market research. She has served at companies such as ExxonMobil, TD Bank, and Toyota, where she has helped employers improve the accuracy of forecasts and supported decision-making.
Sources
[1] CIA World Factbook, 2014-2015. The data used here is based in 2012.
[2] It is based on 2014 data. https://ecodb.net/ranking/old/ts_oili_2014.html; International Gas Union, World LNG Report – 2015 Edition; IEA, Key Coal Trends, 2016.
[3] Department of Energy, Liquefied Natural Gas: Understanding the Basic Facts, 2005.
[4] “Japan looks to import natural gas”, Oil and Gas 360, June 23, 2014, https://www.oilandgas360.com/japan-looks-import-u-s-natural-gas/.
[5] EIA, International Energy Outlook 2016, https://www.eia.gov/forecasts/ieo/nat_gas.cfm.
[6] LNG imports increased from 70 million tonnes in 2010 to 89 million tonnes in 2014 (Trade Statistics of Japan). The gas price increased from $10/MMBtu in January 2010 to over $15/MMBtu in January 2014 in Japan (International Gas Union, World LNG Report – 2016 Edition).
[7] Osamu Tsukimori and Aaron Sheldrick, “As Japan’s oil, gas, power use stalls, coal imports hit new record”, Reuter Business News, January 25, 2016, https://uk.reuters.com/article/uk-japan-energy-demand-idUKKCN0V30N6.
[8] BP Statistical Review of World Energy, June 2016.
[9] Timera Energy, “LNG portfolio implications of a tight vs oversupplied market”, June 16, 2014, https://www.timera-energy.com/lng-portfolio-implications-of-a-tight-vs-oversupplied-market/.
[10] U.S. gas prices averaged below $3.00/MMBtu in every month in 2015, while the Japanese prices shifted between $6.81 to $15 in 2015 (World LNG Report – 2016 Edition).
[11] EIA, “Country analysis: Japan”, January 2015.
[12] Agency for Natural Resources and Energy, Annual Report on Energy, 2015.
[13] In the case of Kyushu Electric, it appears that they did not have enough capacity to generate electricity from hydro and thermal power plants. That may be the reason why they had to rely on oil-fired plants and pushed for resuming nuclear power plants. “Why does Kyushu Electric Want to Resume Genkai Nuclear Power Plant?”, https://blog.livedoor.jp/stop_genpatu/archives/52429038.html.
[14] Agency for Natural Resources and Energy, “Reference Materials for Promoting Cogeneration”, September 2012.
[15] David Hayes, “From adversity to opportunity: CHP in Japan”, January 2012.
[16] “Penetration of Cogeneration and Outlook”, https://www.nega.or.jp/publication/press/2013/pdf/2013_09_08.pdf.
[17] EIA, “How much carbon dioxide is produced when different fuels are burned?”, June 2016, https://www.eia.gov/tools/faqs/faq.cfm?id=74&t=11.
[18] EIA, International Energy Outlook 2016, https://www.eia.gov/forecasts/ieo/nat_gas.cfm.
[19] Sankei News: “Hydro Society has Started”, January 18, 2016, https://www.sankei.com/premium/news/160118/prm1601180014-n1.html.
[20] Agency for Natural Resources and Energy, “High Efficiency of Thermal Plants”, November 2015. It sets “current” as the base year.
[21] Bloomberg, “Energy-Japan-Whitepaper”, June 2, 2016.
[22] Kazuyoshi Harada, “Energy Mix of Japan: Nuclear Power to be 20-22% in 2030”, June 26, 2015, https://www.nippon.com/ja/features/h00114/.
[23] Bloomberg, “Energy-Japan-Whitepaper”, June 2, 2016.
[24] Ibid.